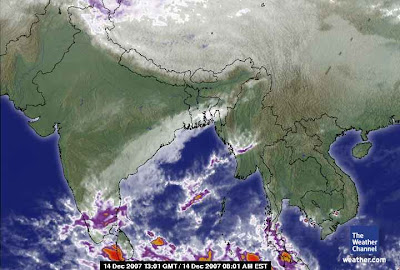
Chennai woke up to a misty/foggy morning.
This is not unusual though... foggy conditions prevailed till 8:30 and slowly moved away to a clear sky.
By afternoon the temperature was 30.6°C @ 12:04pm
and by evening the temperature was dropping at .63°C per hour, now (10:27PM) the temperature is 22.9°C.
Going thru the satellite IR, we can see the remnance of "94B" is near the Saudi Arabia peninsula.
There was some rain around over the south extreme of TamilNadu.
As a whole the cloud formation has began to disintegrate, so ... we can say that's it to North-East monsoon.
Enjoy the winter weather!
Sunday, December 23, 2007
Saturday, December 22, 2007
Hot & Humid
Today from morning the temperature is rising, now it's 30.3°C @ 12:07pm
and humid too 60% for this time of year.
It's all unusual thru this North-east season and early winter.
We might have a LAST show of the North-East air current... early next week(monday/tuesday).
Take a look at the latest satellite pic.
and humid too 60% for this time of year.
It's all unusual thru this North-east season and early winter.
We might have a LAST show of the North-East air current... early next week(monday/tuesday).
Take a look at the latest satellite pic.
Category:
North East Monsoon
Friday, December 21, 2007
Thursday, December 20, 2007
"94B" over Arabian Sea
The tropical system which crossed us and now it's over OPEN arabian seas.
This might become as tropical cyclone..!!??
Category:
Cyclones
A dry day after wet wet
Today in Chennai it was slightly humid and warm thru the day, no rain.
Temperature: 29.7°C @ 11:41am
And the good news is Chennai received good Northeast rainfall
Monthly Rain - 229.6mm (Dec. normal - 138 mm)
Yesterday: 75.0 mm
Here are some figures from yesterday rain thru out Tamilnadu
Thirukoilur (Villupuram dt) and Sathanurdam (Thiruvannamalai dt) 21 each, Virudhachalam (Cuddalore dt), Kallakurichi (Villupuram dt) and Kodaikanal 20 each, Tiruvidaimaruthur 19, Ponneri (Thiruvallur dt) and Cheyyar (Thiruvannamalai dt) 18, Chengam (Thiruvannamalai dt), Coonoor and Satyavedu (Chittoor dt) 17 each, Ulundurpet (Villupuram dt) and Thiruvannamalai 16 each, Thamaraipakkam (Thiruvallur dt) 15, Arani (Thiruvannamalai dt), Gudiyatham (Vellore dt), Vellore, Redhills (Thiruvallur dt), Andipatti (Theni dt) and Tirupathi Airport 14 each, Polur (Thiruvannamalai dt), Ketti (Nilgiris dt), Palani (Dindigul dt), Pakala (Chittoor dt) and Chittoor 13 each, Sankarapuram (Villupuram dt), Vanthavasi (Thiruvannamalai dt) and Ambur (Vellore dt) 12 each, Maduranthagam (Kanchipuram dt), Ramakrishnarajpet and Cholavaram (both Thiruvallur dt), Ambasamudram (Tirunelveli dt), Alangayam (Vellore dt), Uthangarai (Krishnagiri dt), Peraiyur (Madurai dt) and Kalakada (Chittoor dt) 11 each, Tiruttani, Poondi (Thiruvallur dt), Arakonam (Vellore dt), Tirupattur, Vaniyambadi (Vellore dt), Dharapuram (Erode dt), Mulanur (Erode dt), Dindigul, Kuppam (Chittoor dt) and Chittoor 10 each, Kanchipuram, Chengalpattu (Kanchipuram dt), Poonamalle and Korattur (both Thiruvallur dt), Thiruvallur, Panruti (Cuddalore dt), Sirkali (Nagapattinam dt), Harur (Dharmapuri dt), Chatrapatti (Dindigul dt), Sathyamangalam, Bhavanisagar and Kangeyam (all Erode dt), Kothagiri (Nilgiris dt), Periyakulam (Theni dt), Theni, Aruppukottai, Venkatagiri Town and Tada (both Nellore dt), Arogyavaram and Venkatagiri kota (Chittoor dt) 9 each
There is a system still active over south interior tamilnadu.
Take a look at the latest satellite for details
Category:
North East Monsoon
Wednesday, December 19, 2007
Non stop rain...rain
A great low pressure trough has formed over tamilnadu and it covers almost full of tamilnadu.
Take a look at the latest satellite pic...
Looking at the satellite pic you can see Chennai is going to get more, more rain thru the night.
Chennai received and receiving almost non-stop rain from Yesterday morning.
Chennai rainfall amount from 12:00 AM 19-Dec-07 to 6:30 PM 19-Dec-07 is 71.4 MM.
Important and good info is that Chennai rainfall average has crossed the normal december average. Thanks to "94B"
Take a look at the following disturbing figures, recorded 8:30 AM, 19-Dec-07
Orathanadu (Thanjavur dt) and Dharapuram (Erode dt) recorded extremely heavy rainfall of 31 and 27centimetres respectively.
Perungalur (Pudukottai dt) and Thozhudhur (Cuddalore dt) 24 each, Panruti (Cuddalore dt) and Gingee (Villupuram dt) 23 each, Natham and Palani (Both Dindigul dt) 22 each, Vanthavasi (Thiruvannamalai dt) 21, Tiruchirapalli, Thanjavur, Perundurai (Erode dt), Kadavur (Karur dt), Manaparai and Musiri (Both Tiruchirapalli dt) 20 each, Maduranthagam (Kanchipuram dt), Villupuram and Dindigul 19 each, Papanasam (Thanjavur dt), Aravakurichi (Karur dt) and Vedasandur (Dindigul dt) 18 each, Chengalpattu (Kanchipuram dt), Thiruvaiyaru and Valangaiman (Both Thanjavur dt), Needamangalam (Tiruvarur dt), Tiruchirapalli Airport, Mettupatti (Madurai dt), Chatrapatti and Nilakottai (Both Dindigul dt) 17 each, Kallakurichi and Ulundurpet (Both Villupuram dt), Thirukattupalli (Thanjavur dt), Jayamkondam (Ariyalur dt), Devakottai (Sivagangai dt) and Kodaikanal 16 each, Kanchipuram, Kattumannarkoil (Cuddalore dt), Thammampatti (Salem dt), Lalgudi and Pullambadi (Both Tiruchirapalli dt) 15 each, Kodavasal and Mannargudi (Both Tiruvarur dt) 14 each, Tambaram, Virudhachalam (Villupuram dt), Puducherry Airport, Karaikal, Kumbakonam (Thanjavur dt), Nannilam (Tiruvarur dt), Ramanathapuram, Mulanur (Erode dt), Ariyalur and Karaikudi (Sivagangai dt) 13 each, Sriperumpudhur (Kanchipuram dt), Cuddalore, Vanur (Cuddalore dt), Adiramapattinam, Tiruvidaimaruthur (Thanjavur dt), Nagapattinam, Sirkali (Nagapattinam dt), Thiruvarur, Thirumayam (Pudukottai dt), Cheyyar (Thiruvannamalai dt), Kangeyam (Erode dt), Karur, Mayanur (Karur dt), Thathiengarpet (Tiruchirapalli dt) and Andipatti (Theni dt) 12 each, Thiruvallur, Tindivanam and Thirukoilur (Both Villupuram dt), Pattukottai (Thanjavur dt), Muthupet and Thiruthuraipoondi (Both Tiruvarur dt), Harur and Pappireddipatti (Both Dharmapuri dt), Udumalpet (Coimbatore dt), Erode, Ketti (Nilgiris dt), Karur Paramathi, Tiruppuvanam (Sivagangai dt), Chembarambakkam, Redhills and Thamaraipakkam (All Thiruvallur dt) 11 each, Poonamalle and Korattur (Both Thiruvallur dt) and Arakonam (Vellore dt) 10 each, Chennai Airport, Chidambaram (Cuddalore dt), Mayiladuthurai (Nagapattinam dt), Tondi, Polur (Thiruvannamalai dt), Vellore, Paramathi Velur (Namakkal dt), Attur (Salem dt), Yercaud, Bhavani and Gobichettipalayam (Both Erode dt), Thogaimalai (Karur dt), Perambalur, Marungapuri and Thuraiyur (Both Tiruchirapalli dt), Periyakulam and Uthamapalayam (Both Theni dt), Poondi (Thiruvallur dt), Tirupattur (Sivagangai dt) and Sivagangai 9 each, Chennai, Tiruttani (Thiruvallur dt), Parangipettai, Sankarapuram (Villupuram dt), Vallam (Thanjavur dt), Shenkottai (Tirunelveli dt), Arani and Sathanurdam (Both Thiruvannamalai dt), Kumarapalayam (Namakkal dt), Namakkal, Tiruppur (Coimbatore dt), Coonoor, Kulithalai (Karur dt), Vembavur (Perambalur dt), Peraiyur (Madurai dt), Watrap (Virudhunagar dt) and Cholavaram (Thiruvallur dt) 8 each
Category:
North East Monsoon
Tuesday, December 18, 2007
"94B" moves in, Rain thru the day!
The tropical low system "94B" which was far away from land but it moved quickly than anticipated.
From morning, there was non stop sharp showers, and it's still continuing (10:12PM)
The amount of rainfall till now is 36.2mm from 12AM 18-Dec-07.
Monthly Rain - 116.2mm (Dec. normal - 138 mm) (we are nearing the normal average)
Rain is occationally companied by medium gusts, today's high wind 32.2km/hr at 2:36am.
Looking at the prevailing conditions the rainfall will continue till evening tomorrow(19-Dec-07).
Take a look at the satellite pic at 2:35 PM IST
and now very latest
The most of the rainfall has switched to south tamilnadu.
Category:
Cyclones
Good rain from early morning
The low pressure system "94B" is close to northern tamilnadu and it has started giving good rains.
Chennai received light showers in the evening (17-Dec-07) after that sharp showers with mild wind started again around 5 AM (18-Dec-07).
Take a look at the latest infrared pic
you can see that lots of showers are yet to come.
Hoping for a good full day of rain.
Chennai received light showers in the evening (17-Dec-07) after that sharp showers with mild wind started again around 5 AM (18-Dec-07).
Take a look at the latest infrared pic
you can see that lots of showers are yet to come.
Hoping for a good full day of rain.
Category:
Cyclones
Monday, December 17, 2007
Showers from evening, due to "94B"
From morning it was cloudy with fast moving clouds and intermitent high winds.
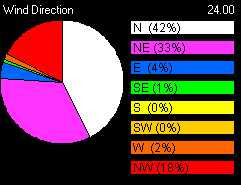
Wind direction is from North-North-East... this is good, take a look at the wind direction summary.
Around 5:30 Pm in the evening it started as a drizzle along with high winds, now (7:46PM) it has become more heavier and intermitent.
These showers may be due to the tropical low "94B", which is nearing northern tamilnadu.
The possibility for this system to become as Depression or Cylcone is very less, because the system has started to weaken over the sea itself.
take a look at the latest visible shot from F-15 overpass.
Let's hope this system crosses us with this present strength. If this system prolongs and moves west then the rain rate might increase from mid-night and will be at the max tomorrow thru the day.
Category:
Cyclones
Sunday, December 16, 2007
Agreement Reached on the Bali Roadmap
It was one day late but countries achieved a major breakthrough on international climate change action at 2:31pm Bali time on Saturday. It was not without high drama featuring plenty of twists and turns along the way on a day when many delegates had planned to catch flights home.
It even took the special intervention of Indonesian President Susilo Bambang Yodhoyono and UN Secretary-General Ban Ki-moon to exhort delegates to complete what seemed like hopelessly deadlocked talks.
Yodhoyono called on countries to complete "the most difficult mile," of an "exhaustive marathon." He told delegates that we could not allow "the human race and the planet to crumble because we cannot find the right words."
The Secretary-General, who returned to Bali after a visit to Timor-Leste, said he was reluctant to speak again to the conference but that he was disappointed in the progress that had been made. "The hour is late. It is time to make a decision." He appealed to delegates not to "risk everything you have achieved so far."
After a morning of false starts and false hopes, miscommunications and misunderstandings, countries agreed on a roadmap to launch negotiations toward a global, comprehensive agreement to address climate change. The Bali decision sets out an agenda that frames the discussions that will take place over the next two years and sets a deadline of 2009 to complete the negotiations.
After agreement was reached, the Secretary-General issued a statement strongly welcoming the outcome and saying that the Bali Roadmap achieved all three of the main objectives. "The Bali Roadmap that has been agreed is a pivotal first step toward an agreement that can address the threat of climate change, the defining challenge of our time."
But the agreement did not come painlessly. On a key provision, concerning the obligations of developing countries in the future negotiations, India, speaking for developing countries, said that alternate wording had been agreed to during the night. And then Bangladesh said that language concerning the least developed countries and small island states had been omitted. The Philippines said the phrase "on the basis of equity" had been omitted. And then the United States said it could not accept the formulation that was put forward but offered to keep working until an agreement could be found.
Then South Africa, responding to the US, said developing countries had voluntarily moved to accept new obligations for their national actions on climate change that were "measurable, reportable and verifiable," a concession that only a year ago, he said, "would have been unthinkable." South Africa asked the US to reconsider its position.
Then an avalanche of countries took the floor in support of the developing country position, many asking the US to state their reservations separately and not block a consensus.
US Under Secretary of State Paula Dobriansky took the floor again and said the US wanted a roadmap and wanted to be part of the roadmap.
"We are very committed to long-term greenhouse gas emission reductions," and she said the US would work with other large emitters to halve global emissions by 2050. And then she said the US "will go forward and join the consensus," which was followed by a thunderous ovation.
"It feels like we are in a movie with lots of plots," said the delegate from Egypt.
After full adoption by the plenary, countries thanked the US for joining the consensus and thanked the secretariat of the Climate Change Convention and the Indonesian government for hosting the Conference.
Category:
Global Warming
Bali climate summit reaches agreement
BALI, Indonesia, Dec. 15 (UPI) -- The United States reluctantly has agreed to join a global effort to negotiate a new climate change treaty to reduce greenhouse gas emissions.
"We will go forward and join consensus," Paula Dobriansky, the head of the U.S. delegation said Saturday.
The United States, in a dramatic reversal, agreed to give poorer countries financial aid and clean technology after the U.S. delegation was booed in Bali at the two-week climate change summit, Britain's Telegraph reported Saturday.
The U.S. delegation did succeed, however, in getting the summit to scrap specific targets to reduce greenhouse gas emissions for itself and other industrial nations. The road map for the proposed treaty now calls for industrial nations to recognize "deep cuts in global emissions" will be needed by 2020, the Telegraph reported.
A new climate treaty, to be negotiated by the end of 2009 and enforced in 2012, would replace the Kyoto Protocol rejected by the United States six years ago.
Category:
Global Warming
Now it's "94B"
Take a look at the visible picture from F-15 overpass provided by US Navy
Read the Navy report about the system
AN AREA OF CONVECTION HAS PERSISTED NEAR 7.5N 87.5E,
APPROXIMATELY 450 NM EAST OF COLOMBO, SRI LANKA. ANIMATED
MULTISPECTRAL IMAGERY REVEALS A FULLY EXPOSED LOW LEVEL CIRCULATION
CENTER (LLCC) WITH BANDING CONVECTION ALONG THE NORTHERN AND WESTERN
PERIPHERY. THE CONVECTION IS DISPLACED 60 NM TO THE NORTH AND WEST
DUE TO MODERATE TO STRONG VERTICAL WIND SHEAR. A SYNOPTIC-SCALE
UPPER LEVEL ANTICYCLONE TO THE NORTH AND EAST IS PROVIDING GOOD
POLEWARD OUTFLOW FOR THE DISTURBANCE. MAXIMUM SUSTAINED SURFACE
WINDS ARE ESTIMATED AT 15 TO 20 KNOTS. MINIMUM SEA LEVEL PRESSURE IS
ESTIMATED TO BE NEAR 1005 MB. DUE TO THE MODERATE TO STRONG VERTICAL
WIND SHEAR, THE POTENTIAL FOR THE DEVELOPMENT OF A SIGNIFICANT
TROPICAL CYCLONE WITHIN THE NEXT 24 HOURS IS POOR.
In chennai, we had a mild day with North-North-westerly winds thru the day, and now (11:03PM) it's very calm.
Today's temperature Hi: 29.4°C @ 11:22am and Low: 25.7°C @ 5:06am
Humidity: Hi: 79% @ 1:33am and Low: 60% @ 11:24am, the humidity is on the high side.
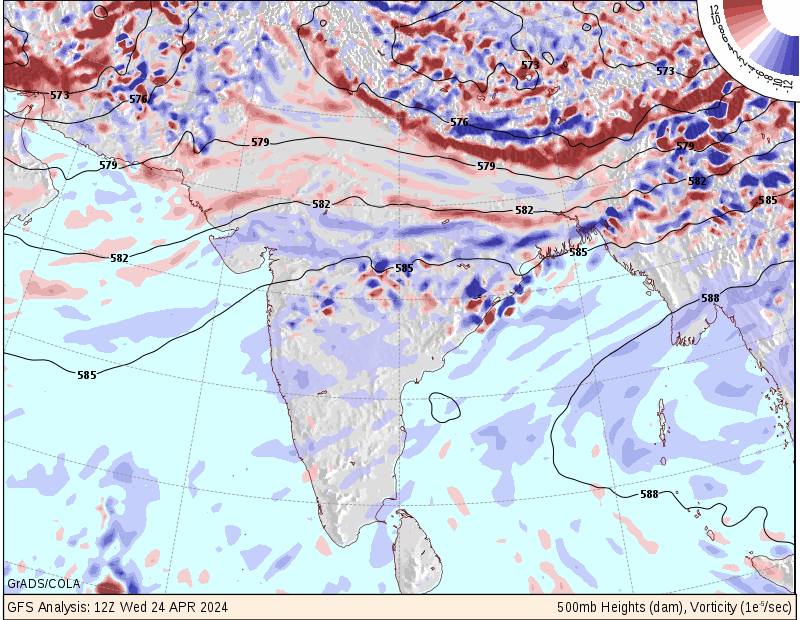
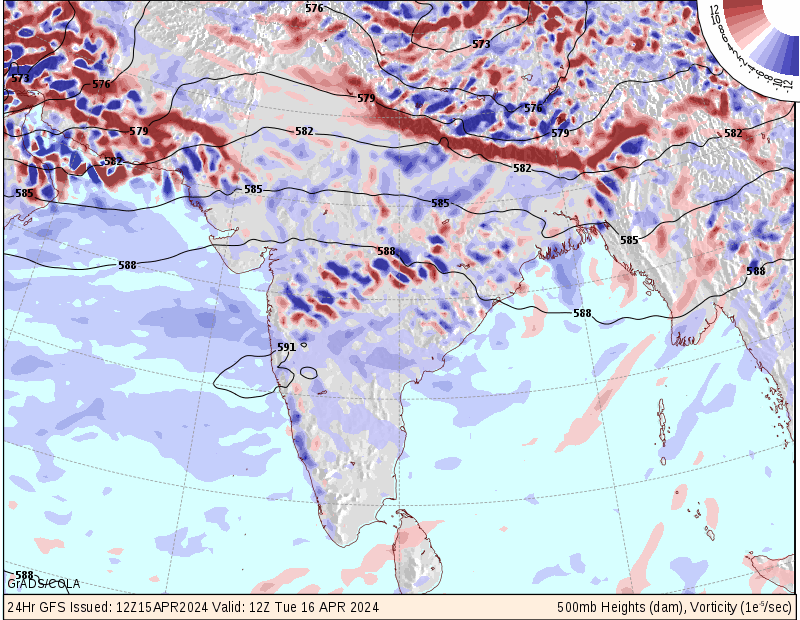
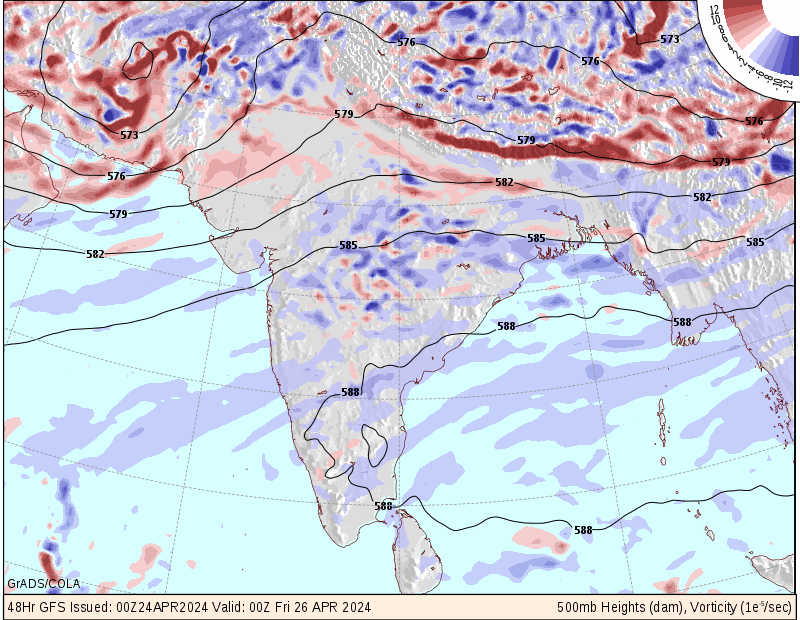
Now take a look at the numerical forecast for next 48hrs.
this too suggests a weak "94B". but more to come at the end of this week..!!!
Category:
North East Monsoon
Saturday, December 15, 2007
What's this?
Take a look at the latest satellite pic
What's this? This system also has a swirl to it.
We'll get back to this tomorrow(16-Dec-07) morning.
What's this? This system also has a swirl to it.
We'll get back to this tomorrow(16-Dec-07) morning.
Category:
Cyclones
Nothing for Chennai!
We (chennai people) did not get any benefit from the tropical disturbance "92B".
Seeing the satellite imagery there's still lot of activity over the south bay, so we might be in chance for getting some showers... early next week.
I'm not ruling out any showers for today! there's a 30% chance of rain today.
Seeing the satellite imagery there's still lot of activity over the south bay, so we might be in chance for getting some showers... early next week.
I'm not ruling out any showers for today! there's a 30% chance of rain today.
Category:
North East Monsoon
Friday, December 14, 2007
December - Bay of Bengal Cyclones
December 1-8,1972
Crossed Tamilnadu coast close to and north of Cudalore at 2330 UTC on 5th December and was within 50 km WNW of Cuddalore at 0300 UTCon December 6. Maximum wind speed recorded at Cuddalore was 111 KMPH to 148 KMPH (60-80) between 2230 UTC of 5th & 0230 UTC of 6th.80 People killed and 30,000 people rendered homeless in Madras due to flood.Total loss Rs. 40 crores.
December 4-11. 1981
Crossed West Bengal Coast near Sagar Island around 1300 UTC on December 10 and weakened into a depression on 11th morning over Bangladesh and into a low the same evening over Assam and Meghalaya.200 people died in 24 Parganas district of West Bengal One Million people affect in the districts of 24 Parganas.
01- 04 Dece. 1993
Crossed on 4th Nov. 30 Km north of Karaikal.100 People died in Tamil Nadu.
28 Nov.-06 Dec1996
crossed near Chennai around 2100 UTC of 6th Dec.1996.The cyclone persisted for 9 days which is reported to be very long life compared to any cyclone in the Indian Ocean. It caused severe damage to life and property.
Category:
Cyclones
"92B" inland and now "93B"
The Low pressure system "92B" moves inland and dissipates...
You can take a look at the latest satellite Infrared pic ... this shows clearly how fast the system has dissipated.
Yesterday's heavy rainfall records...
Nagapattinam and Sirkali (Nagapattinam dt) 13 each, Mayiladuthurai (Nagapattinam dt) 12, Vedaranyam, Karaikal, Orathanadu (Thanjavur dt) and Thiruvarur 11 each, Chidambaram (Cuddalore dt) 10, Thiruthuraipoondi (Tiruvarur dt) 9, Parangipettai, Tiruvidaimaruthur (Thanjavur dt) and Muthupet (Tiruvarur dt) 8 each and Cuddalore, Kattumannarkoil (Cuddalore dt), Adiramapattinam, Pattukottai (Thanjavur dt), Valangaiman and Kodavasal (both Tiruvarur dt) 7 each
Now the US navy is reporting another tropical disturbance "93B", it's very early stage so no comments now.
Category:
Cyclones
"92B" moves inland
Just take a look at the latest satellite pic and make out...
In Chennai, there's just heavy drizzle now(9:36 AM).
There's also reports about drizzles and showers from various part of Tamilnadu.
In Chennai, there's just heavy drizzle now(9:36 AM).
There's also reports about drizzles and showers from various part of Tamilnadu.
Category:
Cyclones
Thursday, December 13, 2007
Outer edge of "92B"
Present position of Tropical Depression
13/1430 UTC LAT = 8.8N LONG = 81.4E CATEGORY = T1.5/2.0
Latest bulletin from US Navy
THE AREA OF CONVECTION PREVIOUSLY LOCATED NEAR 7.2N 84.8E,
IS NOW LOCATED NEAR 9.1N 82.4E, APPROXIMATELY 200 NM NORTHEAST OF
COLOMBO, SRI LANKA. RECENT ANIMATED MULTISPECTRAL AND WATER VAPOR
SATELLITE IMAGERY SHOW CONVECTION FLARING ON THE NORTHERN PERIPHERY
OF A WELL-DEFINED LOW LEVEL CIRCULATION CENTER (LLCC) EVIDENT IN A
130348Z ASCAT PASS. THE DISTURBANCE LIES UNDER AN AREA OF FAVORABLE
POLEWARD DIFFLUENCE ALOFT AND MODERATE VERTICAL WIND SHEAR ASSOCIATED
WITH THE PERIPHERAL WINDS OF AN UPPER LEVEL ANTICYCLONE CENTERED WELL
TO THE EAST OVER THE WESTERN NORTH PACIFIC OCEAN. MAXIMUM SUSTAINED
SURFACE WINDS ARE ESTIMATED AT 20 TO 25 KNOTS. MINIMUM SEA LEVEL
PRESSURE IS ESTIMATED TO BE NEAR 1004 MB. THE POTENTIAL FOR THE
DEVELOPMENT OF A SIGNIFICANT TROPICAL CYCLONE WITHIN THE NEXT 24
HOURS REMAINS FAIR.
Take a look at the latest Satellite pic.
Chennai was totally cloudy thru the day.
From evening onwards there was sprinkling of rain, it's continuing now(10:33 PM) also.
The rain rate will increase from early morning.
The above forecast is only IF the present system is sustained and moves east.
According to me the present "92B" depression might break off before tomorrow evening, that too over SEA itself.
Category:
Cyclones
"92B" has sustained
TROPICAL DISTURBANCE UPDATE
Bay of Bengal - 2030 GMT
System 92B
Position 7.1N 83.9E
Likelihood of a tropical cyclone forming within 24 hours: FAIR
Here in chennai, morning (8:49 AM).
It's heavily cloudy. This may the outer edge of the depression "92B".
Let's hope this system brings us good rain.
Take a look at the latest numeric forecast for next 24hrs
Category:
Cyclones
Wednesday, December 12, 2007
"92B" is moving
Here's the latest report from US navy ...
THE AREA OF CONVECTION PREVIOUSLY LOCATED NEAR 4.9N 85.5E,
IS NOW LOCATED NEAR 7.2N 84.9E, APPROXIMATELY 295 NM EAST OF
COLOMBO, SRI LANKA. RECENT ANIMATED MULTISPECTRAL AND WATER VAPOR
SATELLITE IMAGERY SHOW CONVECTION FLARING ON THE NORTHERN PERIPHERY
OF A WELL-DEFINED LOW LEVEL CIRCULATION CENTER (LLCC) EVIDENT IN A
120409Z ASCAT PASS. THE DISTURBANCE LIES UNDER AN AREA OF FAVORABLE
POLEWARD DIFFLUENCE ALOFT AND MODERATE VERTICAL WIND SHEAR
ASSOCIATED WITH THE PERIPHERAL WINDS OF AN UPPER LEVEL ANTICYCLONE
CENTERED WELL TO THE EAST OVER THE WESTERN NORTH PACIFIC OCEAN.
MAXIMUM SUSTAINED SURFACE WINDS ARE ESTIMATED AT 20 TO 25 KNOTS.
MINIMUM SEA LEVEL PRESSURE IS ESTIMATED TO BE NEAR 1005 MB. THE
POTENTIAL FOR THE DEVELOPMENT OF A SIGNIFICANT TROPICAL CYCLONE
WITHIN THE NEXT 24 HOURS REMAINS FAIR.
Take a look at the latest Satellite pic from F-15 pass over (US Navy)
Infrared from Weather.com
Category:
Cyclones
Almost a Depression "92B"
Past positions
10-Dec ---> 5.3N 85.4E
11-Dec ---> 5.7N 85.4E
12-Dec ---> 4.5N 85.6E
Category: T1.0/1.5
It has moved...
TROPICAL DISTURBANCE UPDATE
Bay of Bengal - 1800 GMT
System 92B
Position 4.9N 85.5E
Location 355 miles ESE of Colombo, Sri Lanka
Likelihood of a tropical cyclone forming within 24 hours: FAIR
This disturbance has maintained its structure, although atmospheric conditions continue to be less than favourable. Any improvement could give rise to a fully fledged cyclone
Take a look at the latest satellite...
Category:
Cyclones
Tuesday, December 11, 2007
Latest on "92B"
What's is happening with LOW 92B.
It's just a low pressure system, lying south-east of Srilanka.
I still have lots of IF's and BUT's about the system because it's very slow to develop and move.
Here is the latest satellite imagery...
In Chennai, today morning it was cloudy and almost rain. Though the cloud was not heavy by no means but it was surely shower bearing ones. By mid-noon everything cleared off and it was just hazy towards the evening.
Temperature was Hi: 29.5°C @ 1:31pm
and Humidity was Low: 56% @ 1:37pm... very low indeed at noon.
Category:
Cyclones
Monday, December 10, 2007
Potential Tropical Cyclone
This is the latest advisory from JTWC Issued at 10/1800Z
MSGID/GENADMIN/NAVPACMETOCCEN PEARL HARBOR HI/JTWC//
SUBJ/SIGNIFICANT TROPICAL WEATHER ADVISORY FOR THE INDIAN
/OCEAN/101800Z-111800ZDEC2007//
1. NORTH INDIAN OCEAN AREA (MALAY PENINSULA WEST TO COAST OF AFRICA):
A. TROPICAL CYCLONE SUMMARY: NONE.
B. TROPICAL DISTURBANCE SUMMARY:
(1) THE AREA OF CONVECTION PREVIOUSLY LOCATED NEAR 3.3N 85.3E,
IS NOW LOCATED NEAR 3.7N 86.1E, APPROXIMATELY 420 NM EAST-SOUTHEAST
OF COLOMBO, SRI LANKA. ANIMATED INFRARED SATELLITE IMAGERY INDICATES
A DEVELOPING LOW-LEVEL CIRCULATION CENTER (LLCC) WITH FLARING DEEP
CONVECTION NEAR THE CENTER. A 101414Z SSMIS IMAGE DEPICTS A DEFINED
LLCC WITH FORMATIVE CONVECTIVE BANDING WRAPPING INTO THE EAST
QUADRANT. UPPER-LEVEL ANALYSIS DEPICTS AN ANTICYCLONE LOCATED NEAR
3N 86E, JUST SOUTHEAST OF THE CENTER, WHICH IS PRODUCING GOOD
DIFFLUENCE BUT MODERATE VERTICAL WIND SHEAR. MAXIMUM SUSTAINED
SURFACE WINDS ARE ESTIMATED AT 20 TO 25 KNOTS. MINIMUM SEA LEVEL
PRESSURE IS ESTIMATED TO BE NEAR 1004 MB. THE POTENTIAL FOR THE
DEVELOPMENT OF A SIGNIFICANT TROPICAL CYCLONE WITHIN THE NEXT 24
HOURS REMAINS FAIR.
Category:
Cyclones
Activity over South Bay increasing
After we have reported yesterday about the "Activity over south bay"... now it's showing signs of developing into a Depression.
Still the whole mass of system is South of Bay of Bengal.
Take a look at this INFRARED satellite pic...
Chennai today experienced a bit Hot day with temperature Hi: 30.1°C @ 12:24pm.
Wind condition is still mostly North-East.
No rain and no sign of it today.
And expect rain during the weekend!
Still the whole mass of system is South of Bay of Bengal.
Take a look at this INFRARED satellite pic...
Chennai today experienced a bit Hot day with temperature Hi: 30.1°C @ 12:24pm.
Wind condition is still mostly North-East.
No rain and no sign of it today.
And expect rain during the weekend!
Category:
North East Monsoon
Sunday, December 09, 2007
Latest Earth Quake ... daily update
Update time = Sun Dec 9 9:00:26 UTC 2007
MAG UTC DATE-TIME
y/m/d h:m:s LAT
deg LON
deg DEPTH
km Region
MAP 3.7 2007/12/09 07:40:46 63.023 -148.152 100.0 CENTRAL ALASKA
MAP 7.6 2007/12/09 07:28:24 -26.156 -177.453 187.6 SOUTH OF THE FIJI ISLANDS
MAP 4.8 2007/12/09 05:34:30 12.360 125.589 31.7 SAMAR, PHILIPPINES
MAP 4.9 2007/12/09 05:27:18 -19.107 -68.964 81.6 TARAPACA, CHILE
MAP 5.2 2007/12/09 05:22:16 12.285 125.329 84.3 SAMAR, PHILIPPINES
MAP 2.5 2007/12/09 05:15:20 51.389 -178.765 59.7 ANDREANOF ISLANDS, ALEUTIAN IS., ALASKA
MAP 3.1 2007/12/09 03:07:30 52.529 -174.434 91.1 ANDREANOF ISLANDS, ALEUTIAN IS., ALASKA
MAP 4.8 2007/12/09 02:23:01 2.300 126.848 70.4 MOLUCCA SEA
MAP 4.9 2007/12/09 02:03:29 -15.049 -44.199 10.0 MINAS GERAIS, BRAZIL
MAP 2.7 2007/12/09 01:12:25 62.288 -150.218 56.1 CENTRAL ALASKA
You can view a comprehensive list here
Category:
EarthQuakes
Lots of activity over south Bay
For the past 6 days there was bit and pieces of showers which has resulted in 65.4mm (Dec. normal - 138 mm).
Yesterday and Today (9-Dec-07) till now there was no rain, not dry and even the temperature was also on the high side.
Yesterday's temperature Hi: 29.7°C @ 12:04pm Low: 23.3°C @ 6:26am.
Yesterday's Humidity Hi: 95% @ 4:54am Low: 59% @ 1:29pm
Now coming to the South-Bay activity. Take a look at the latest satellite pic ...
What's happening there? Will it develop into a Depression or something??
I think it'll because the present prevailing conditions is leading to that.
The following is from a Weather blog hosted by www.accuweather.com
"It has been dry lately over southern India, where rains of the North East Monsoon shut off. Now, the same shift in atmospheric patterns allowing rain to reach the northern Subcontinent (this being a trough in the Westerlies--a `western disturbance`), may draw some wetting rains back into Sri Lanka and southeastern India from the southeast. Further ahead in time, there is even the possibility of scattered rain (popping up mid to late week) over the heart of India."
And even the latest numeric forecast also suggests that, take a look ...
Category:
North East Monsoon
Saturday, December 08, 2007
The rare "Red Bananas"
Selection Information
Usage: Used for baking.
Selection: Good-quality Red Bananas are slightly soft and the skin will be purple or maroon-red. Slight scars do not affect quality.
Avoid: Avoid product that is extremely soft, completely black or spotted with mold around the stem.
Seasonal Information
Available year-round from Ecuador and Mexico.
Red Banana Nutritional Information
Serving Size: 1 medium banana (126g)
Amount Per Serving
Calories 110
Calories from Fat 0%
Total Fat 0
0%
Cholesterol 0mg
0%
Sodium 0mg
0%
Total Carbohydrate 29g
10%
Dietary Fiber 4g
16%
Potassium 400mg
10%
Sugars 21g
Protein 1g
Vitamin A 0%
Vitamin C 15%
Calcium 0%
Iron 0%
Vitamin B6 20%
*Percent Daily Values are based on a 2,000 calorie diet. Your daily values may be higher or lower depending on your calorie needs.
Source: PMA's Labeling Facts
Low Fat, Sodium-free, Source of fiber and potassium,
Source of vitamin C & B6, Cholesterol-free.
For full nutritional facts of Bananas clik here
Banana Tips & Trivia
To ripen green bananas, put them into a plastic bag, seal it and place the bag in a warm place like on top of your refrigerator. This will cause the bananas to heat up which speeds the ripening process. You can also put other green fruit like peaches and pears into the bag with a ripe banana, and they will ripen faster as well!
You can freeze bananas! Just peel and store in plastic bags up to 6 months.
Thaw and drain frozen extra-ripe bananas and use in baked goods... or slice frozen into blender drinks. Have for breakfast, snack, refreshment or as a frosty ice cream-like dessert without all the extra fat or calories.
Sauté green-tipped bananas until brown in just enough margarine or cooking spray to coat. Serve as a side dish or "starch" with chicken, pork or even fish.
As the green color of bananas turns to yellow, the starch in the fruit turns to sugar.
Alexander the Great discovered bananas in his conquest of India in 327 B.C.
Bananas don't grow on trees, as is commonly believed. They grow on compacted, water-filled leaf stalks that grow up to 25 feet high. They are the world's largest herb. (Source: The Packer, 9/9/89)
Category:
Tourism
India's Global Warming Fears
In India, weather-related natural disasters already cause annual chaos.
Two months ago, whole regions of West Bengal disappeared under water - rescue workers had to use boats to give emergency help to more than 16 million affected people.
These were the worst floods for more than 20 years.
One of the problems is that these models are sometimes converted into scary stories which is something we shouldn't fall for
Dr RR Kelkar
Several factors were blamed - from silted riverbeds to mismanagement of resources. But could global warming also have played a part?
Journalist Nirmal Ghosh firmly believes global warming is going to cause far more chaos across India in the future.
"Global warming is going to make other small local environmental issues... seem like peanuts, because it is the big one which is going to come and completely change the face of the Earth.
"We're talking about mass migrations because of changing weather. That will have implications on politics. There are states in India which are fighting court cases over water," Mr Ghosh says.
Shrinking glaciers
As well as floods, India also suffers acute water shortages - earlier this year the western state of Rajasthan was struck by drought.
Nirmal Ghosh says the steady shrinking of Himalayan glaciers means the entire water system is being disrupted - global warming, he says, will cause even greater extremes.
The Himalayan glaciers are said to be shrinking
"Statistically, it is proven that the Himalayan glaciers are actually shrinking, and within 50 to 60 years they will virtually run out of producing the water levels that we are seeing now.
"This will cut down drastically the water available downstream, and in agricultural economies like the plains of UP (Uttar Pradesh) and Bihar, which are poor places to begin with. This is probably going to, over a short period of time, cause tremendous social upheaval," he says.
Not everyone agrees. Some scientists say the glaciers have been shrinking for decades and other factors are to blame.
Certainly, India has a long history of extreme weather patterns - and extremes of temperature across the continent. So is it too simplistic to blame global warming just because recent floods and droughts have been acute?
West blamed
Dr RR Kelkar, the director general of the Indian meteorological department, says it is too early for accurate data to be available yet.
"India is a tropical country, we must remember that. We are used to hot environments, we are used to heavy rains, we are used to cyclones, and really there is no clear statistically significant trend that things are going to change drastically.
India suffers acute water shortages
"There is a need now for scientists to probe into them and find out how they will be affecting us - but one of the problems is that these models are sometimes converted into scary stories which is something we shouldn't fall for," Dr Kelkar says.
Scary stories or not, there are also concerns that knowledge being gathered about the impact of global warming is controlled by the West.
Scientists in the subcontinent do not always have the resources available to challenge data being compiled by developed countries.
Professor SK Sinha is a specialist at the water technology centre at the Pusa Institute. He accuses the West, and in particular the United States, of manipulating the debate.
"They make the rules. In fact, they even lure people from the developing countries to substantiate or to confirm that data, not necessarily always with very valid equipments and arguments," he says.
Cyclones, floods and droughts aren't in themselves new - but how much is global warming likely to worsen them, and how far will countries like India be able to influence the global debate?
Courtesy "BBC News"
Category:
Global Warming
Coldest day for Chennai????
The lowest temperature in chennai in the past 10 years was 62 degrees Fahrenheit i.e. about 16.7 degrees Centigrade. This was recorded on 27th January 1999.
The link I have provided in the source will give you the recorded temperature by days for any day/month or week and you can review the temperatures over December, January and February months over the last 10 years and figure out the coldest days in Chennai.
In addition, in the last 10 years, 64 deg F was recorded on the following days: (with the Max temp in parenthesis)
30 Jan 1999 - 64 (89)
31 Jan 1999 - 64 (87)
20 Feb 2004- 64 (87)
14 Feb 2005- 64 (94)
19 Jan 2006 - 64 (87)
15 Feb 2006- 64 (90)
In addition, you will find that there was this recorded temperature of 41 deg F on Dec 19, 1999 (at 10 am) and also 37.4 deg F on 4 Feb 2004 (at 2 am). Interestingly, within an hour of these records, the temperature was above 70 deg F. Therefore, it is very likely that these were human errors while creating the webpage. I believe the above to be true based on the following, which records that in the NOrth, you do not get temp below 10.2 since 70's!
Elsewhere, you find the following, which is authentic record from weather related sites about Tamil Nadu, and yuo can infer from this, some truth about Chennai (madras):
In Tamil Nadu January is the coldest month when the daily minimum temperature for the state as a whole is 21C varing from about 16C in the north to about 24C in the south. The lowest temperature ever recorded at an individual station in the plain is 10.2C. at Tirupattur on 15th December 1974 which is 5.9C lower than the normal of the coldest month. In the ghat areas Uthagamandalam registered the lowest minimum temperature of -2.1C on 7th January 1976 which is 7.3C lower than the normal of the coldest month.
Finally, some sites state the lowest temp recorded in Chennai as being 15.8, which although authentic (mentioned in many sites and books about Chennai), but possibly not in the last ten years as the temp never went below 62 deg F in the last 10 years (but for those two dates, which i believe are human errors in recording in the internet page!).
btw, 15.8 deg C means 60.44 deg Fahrenheit - almost 1.56 degree F lower than the recorded 62 in the last 10 years.
Category:
Winter
Friday, December 07, 2007
Present Rainfall
Yesterday Rain - 25.8 mm (ending 00hrs 7-Dec-2007)
24 Hour Rain - 39.0mm (from 00 hrs 7-Dec-2007)
Current Rain Rate: 2.200 (9 AM)
Monthly Rain - 65.2mm (Dec. normal - 138 mm)
24 Hour Rain - 39.0mm (from 00 hrs 7-Dec-2007)
Current Rain Rate: 2.200 (9 AM)
Monthly Rain - 65.2mm (Dec. normal - 138 mm)
Category:
North East Monsoon
Rain limited to North-Tamilnadu
The present spell of rain is limited to North-Tamilnadu and Southern extreme of Andhra Pradesh. You can view the IMD-Chennai report and see for yourself.
GOVERNMENT OF INDIA
INDIA METEOROLOGICAL DEPARTMENT
REGIONAL METEOROLOGICAL CENTRE, 6, COLLEGE ROAD, CHENNAI - 600 006.
REGIONAL DAILY WEATHER REPORT FOR TAMILNADU, PUDUCHERRY, ANDHRAPRADESH, KARNATAKA, KERALA AND LAKSHADWEEP
THURSDAY, 6TH DECEMBER 2007 / 15TH AGRAHAYANA 1929 (SAKA)
SUMMARY OF OBSERVATIONS RECORDED AT 0830 HRS IST:
Rainfall occurred at a few places over Rayalaseema and isolated rainfall occurred over Tamilnadu and Coastal Andhrapradesh. Mainly dry weather prevailed over Lakshadweep and South Interior Karnataka and dry weather prevailed over Telangana, Kerala, Coastal and North Interior Karnataka.
The chief amounts of rainfall recorded in cms are:
Gudur (Nellore dt) 5, Venkatagiri Town (Nellore dt), Sulurpet (Nellore dt) and Srikalahasti (Chittoor dt) 4 each, Rapur and Tada (both Nellore dt) 3 each, Tamaraipakkam (Thiruvallur dt), Tiruttani, Sholinghur (Vellore dt) and Tirupathi Airport 2 each and Thiruvallur, Ponneri, Poonamalle, Korattur, Red Hills and Chembarambakkam (all Thiruvallur dt), Chennai, Tambaram, Maduranthagam (Kanchipuram dt), Ulundurpet (Villupuram dt), Vellore, Satyavedu, Kalakada and Puttur (all Chittoor dt), Chittoor and Rajampet (Cuddapah dt) 1 each.
The minimum temperature fell appreciably at one or two places over Telangana, Tamilnadu, fell at one or two over rest Tamilnadu and changed little elsewhere over the region.
They were appreciably below normal at one or two places over Telangana, below normal at one or two places over Coastal Andhrapradesh, appreciably above normal at one or two places over Coastal Karnataka, South Coastal Andhrapradesh and were generally normal over the rest of the region.
Adilabad and Bijapur recorded the lowest minimum temperature of 10 degree Celsius in the plains of the region.
Category:
North East Monsoon
Thursday, December 06, 2007
Great little weather maps
World current conditions
World Relative Humidity
World satellite map
Another world satellite map
India satellite map
All provided by Intellicast
World Relative Humidity
World satellite map
Another world satellite map
India satellite map
All provided by Intellicast
Category:
Satellite Maps
Monsoon active
Today morning we had a good spell of rain. The north-east monsoon is active over northern tamilnadu.
Yesterday Rain - 6.6 mm
24 Hour Rain - 27.6mm (from 12 AM - 6-Dec-07)
In the evening also it's cloudy and bit of rain around. The humidity level is also high thru the day, this is good sign for rain.
Moreover the wind direction for the past 5 days is good mostly North-North-East.
Take a look at the wind direction summary for past 5 days...
Till now there's not a bit of cloud OR cloud formation over the BAY region.
Category:
North East Monsoon
Wednesday, December 05, 2007
Climate Change Pushing Tropics Farther, Faster
December 3, 2007
Over the past 25 years the tropics have expanded by as much as 300 miles (500 kilometers) north and south—evidence of climate change in action, a new study says.
This not only means that rain-drenched regions near the Equator are growing, experts say, but also that global warming may be pushing deserts poleward in places such as the U.S. Southwest, Mexico, Australia, South Africa, South America, and the Mediterranean.
"The rate of increase is pretty big," said study lead author Dian Seidel of the National Oceanographic and Atmospheric Administration's (NOAA) Air Resources Laboratory in Silver Spring, Maryland.
"It's several degrees of latitude over the course of 25 years."
Tracking Air Circulation
If it sounds strange to think of the tropics as expanding, that's because geographers and climate scientists view them differently. To mapmakers, the tropics are simply the regions between 23.5 degrees north and south latitude, where at least once a year the sun is directly overhead.
But Seidel and her team based their definition of the tropical belt on air circulation.
Near the Equator, moist air rises, producing clouds and ideal conditions for rain forests.
That air then moves poleward—north in the Northern Hemisphere, south in the Southern Hemisphere.
Wrung dry of moisture, the air eventually descends back to Earth, producing deserts. Surface breezes then angle back toward the Equator, completing the cycle.
Seidel's team used meteorological and satellite data to find the northern and southern edges of this zone, mapping changes from the late 1970s to the present.
Within the tropics, for example, there is less stratospheric ozone—the compound that absorbs harmful UV radiation from the sun—than in the zones to the north and south.
Jet streams—fast-moving air currents traveling through Earth's atmosphere—are also influenced by the air circulation boundary between the tropics and other zones.
Also, satellites can "see" the temperature difference between cold, high-altitude cloud tops near the Equator and warmer surface lands in the cloudless dry zones to the north and south.
Seidel's team tracked changes in five measures of the tropical-subtropical air circulation boundary.
All five showed that the tropical zone was steadily broadening, at a rate of 2.5 to 4.8 degrees latitude every 25 years.
The study appears in the advance online edition of the new journal Nature Geoscience.
Faster Than Anticipated
Global climate-change models predict that the tropics will expand as Earth warms up, Seidel said, but her team's observed expansion was much faster than predicted.
"The models indicate only fractions of a degree," she said.
Seidel and colleagues aren't sure why the tropics' spread has been so much more rapid.
But she thinks it might have something to do with the stratosphere, the second layer of Earth's atmosphere, which isn't well represented in most climate models.
Because current models don't explain what's going on, it's impossible to tell whether the tropics expansion is part of a cycle that might reverse in the future or an indicator that global warming is having stronger-than-anticipated effects.
'Unpredictable Consequences'
If the trend continues, however, the impacts would extend well beyond the tropics.
That's because the shift in the Northern and Southern Hemisphere jet streams could alter the tracks of storms, such as those that hit the U.S. West Coast each winter.
"If some of that storminess moves farther north, there is potential for changes in water supply [and] snowpack—things that determine climate in mid-latitudes, where a lot of agriculture is dependent on reliable rainfall," Seidel said.
Steven Running, a professor of ecology at the University of Montana who was not involved in the study, said there could be ecological changes.
"Biogeographers define tropical ecosystems [as existing] in climate zones where it never freezes—a very fundamental biophysical threshold," Running said by email.
That keeps cold-intolerant species—such as mosquitoes—from migrating into today's temperate latitudes, he said. (Read about dengue fever's spread and its link to climate change.)
"If tropical climates move, the tropical-temperate geographic transition of ecosystems will be disrupted—with very unpredictable consequences."
Category:
Global Warming
2007 Hurricane Season Ending Raises Forecast Concerns
November 30, 2007
The 2007 Atlantic hurricane season, which officially ends today, has—like last year—failed to live up to the predictions of forecasters.
Now some experts fear the second year of inaccurate preseason predictions will shake the public's faith in all hurricane forecasts—even when a storm is bearing down upon them.
"I'm concerned that the public could lose confidence in the forecasting of individual storms because of the inaccuracies of long-range forecasts," said Max Mayfield, a hurricane specialist at WPLG-TV in Miami and former director of the National Hurricane Center in Miami, Florida.
Meteorologists at Colorado State University and the National Oceanic and Atmospheric Administration predicted as many as 17 named storms in the Atlantic Basin this summer.
But only 14 storms formed between June 1—the official start of the season—and today. The total does not include Tropical Storm Andrea, which formed off the coast of Georgia three weeks before the season's start.
The problem, he said, is that there is widespread public interest in the preseason hurricane forecasts.
"The most regularly asked question I had—even before, How are the wife and kids?—was, What kind of hurricane season are we going to have?" Mayfield said.
But after so many wrong calls, the public may no longer differentiate between tenuous preseason predictions and the Hurricane Center's forecasts for individual storms, he said.
Cool Explanation
The summer did produce two extremely intense hurricanes—Dean in August and Felix in September—that caused catastrophic damage in Mexico, Mayfield notes. (Read more about Hurricane Dean and Hurricane Felix.)
And conditions were ripe this year for a very active hurricane season, so it's puzzling why it fizzled out, he said.
It was especially surprising that three storms that formed at the season's peak in September—Ingrid, Jerry, and Karen—didn't develop into powerful hurricanes, he added.
Meteorologist Phil Klotzbach, who issues the Colorado State forecasts with mentor William Gray, said the lower-than-forecast storm total was caused by several factors.
These included cooler sea-surface temperatures than anticipated and upper-level winds over the Atlantic Ocean that prevented storms from intensifying.
Windblown dust from Africa may have blocked sunlight, causing the cooler ocean temperatures, he said. Tropical storms draw their strength from warm ocean waters.
Klotzbach said he and Gray will try to factor in the presence or absence of dust in their future seasonal hurricane forecasts, noting that seasonal forecasts are still an evolving science.
Reason for Thanks
Despite the inaccuracies in recent seasonal forecasts, emergency management consultants still think they are useful.
"Some people don't like them because they say it creates unnecessary hysteria," said Hans Wagner, vice president of Early Alert in Tampa, Florida. The company provides disaster management information and assistance to government agencies and private industries.
"We look at [the forecasts] as a planning tool," he said.
While the company is always on high alert during hurricane season, "when they predict an above-normal season, that always stimulates our clients to take necessary precautions and take the threat more seriously, and that helps us if they are actually threatened by a hurricane," he added.
Joe Bastardi, a meteorologist with the private weather forecasting service AccuWeather, said too much emphasis is being placed on the accuracy of preseason forecasts.
"It's almost like it's turned into theologians arguing about how many angels can fit on the head of a pin," Bastardi said.
"Overall, the nation got off very easy this year and last year.
"We are in a time until about 2020 that hurricane threats will be more frequent and more intense on our coastlines. So instead of saying, Ha, ha, ha, there's nothing going on, people should be thankful that there's not as much going on."
The 2007 Atlantic hurricane season, which officially ends today, has—like last year—failed to live up to the predictions of forecasters.
Now some experts fear the second year of inaccurate preseason predictions will shake the public's faith in all hurricane forecasts—even when a storm is bearing down upon them.
"I'm concerned that the public could lose confidence in the forecasting of individual storms because of the inaccuracies of long-range forecasts," said Max Mayfield, a hurricane specialist at WPLG-TV in Miami and former director of the National Hurricane Center in Miami, Florida.
Meteorologists at Colorado State University and the National Oceanic and Atmospheric Administration predicted as many as 17 named storms in the Atlantic Basin this summer.
But only 14 storms formed between June 1—the official start of the season—and today. The total does not include Tropical Storm Andrea, which formed off the coast of Georgia three weeks before the season's start.
The problem, he said, is that there is widespread public interest in the preseason hurricane forecasts.
"The most regularly asked question I had—even before, How are the wife and kids?—was, What kind of hurricane season are we going to have?" Mayfield said.
But after so many wrong calls, the public may no longer differentiate between tenuous preseason predictions and the Hurricane Center's forecasts for individual storms, he said.
Cool Explanation
The summer did produce two extremely intense hurricanes—Dean in August and Felix in September—that caused catastrophic damage in Mexico, Mayfield notes. (Read more about Hurricane Dean and Hurricane Felix.)
And conditions were ripe this year for a very active hurricane season, so it's puzzling why it fizzled out, he said.
It was especially surprising that three storms that formed at the season's peak in September—Ingrid, Jerry, and Karen—didn't develop into powerful hurricanes, he added.
Meteorologist Phil Klotzbach, who issues the Colorado State forecasts with mentor William Gray, said the lower-than-forecast storm total was caused by several factors.
These included cooler sea-surface temperatures than anticipated and upper-level winds over the Atlantic Ocean that prevented storms from intensifying.
Windblown dust from Africa may have blocked sunlight, causing the cooler ocean temperatures, he said. Tropical storms draw their strength from warm ocean waters.
Klotzbach said he and Gray will try to factor in the presence or absence of dust in their future seasonal hurricane forecasts, noting that seasonal forecasts are still an evolving science.
Reason for Thanks
Despite the inaccuracies in recent seasonal forecasts, emergency management consultants still think they are useful.
"Some people don't like them because they say it creates unnecessary hysteria," said Hans Wagner, vice president of Early Alert in Tampa, Florida. The company provides disaster management information and assistance to government agencies and private industries.
"We look at [the forecasts] as a planning tool," he said.
While the company is always on high alert during hurricane season, "when they predict an above-normal season, that always stimulates our clients to take necessary precautions and take the threat more seriously, and that helps us if they are actually threatened by a hurricane," he added.
Joe Bastardi, a meteorologist with the private weather forecasting service AccuWeather, said too much emphasis is being placed on the accuracy of preseason forecasts.
"It's almost like it's turned into theologians arguing about how many angels can fit on the head of a pin," Bastardi said.
"Overall, the nation got off very easy this year and last year.
"We are in a time until about 2020 that hurricane threats will be more frequent and more intense on our coastlines. So instead of saying, Ha, ha, ha, there's nothing going on, people should be thankful that there's not as much going on."
Category:
Global Warming
Weather CAMs live - USA
Here is a good LINK which has various links for LIVE weather cams thru out USA.
We should host some weather CAMS in India, i know it's costly, atleast we should try and host one each in 4 metros.
I hope soon my company will venture into it.
If anyone of my readers have hosted a LIVE WEB CAM in any area in INDIA, please send the link to weatherblog@gmail.com
or just post it as COMMENTS to this post.
Category:
News
Mild rain continue...
Today morning (5-Dec-07) also there was a mild shower.
All Conditions are favourable for North-east monsoon to extend for another 48hrs or so.
You can take a look at the latest wind direction summary,
and the last 5 days humidity summary.
Going thru the latest satellite pic you cannot make out anything related to these showers. So good going...
All Conditions are favourable for North-east monsoon to extend for another 48hrs or so.
You can take a look at the latest wind direction summary,
and the last 5 days humidity summary.
Going thru the latest satellite pic you cannot make out anything related to these showers. So good going...
Category:
North East Monsoon
Tuesday, December 04, 2007
We are back, It's humid & rain!
We are back online after 3 days.
we were at Tirunelveli for the past 3 days...It's located down south of Tamilnadu.
There also the climate was a bit humid and some drops of rain. Nights and early morning are somewhat cold.
Now coming to chennai, On sunday the North-east current has revived slightly enough to bring some showers for the city.
This is not unusual for this time of year. The rainfall records for the past 2 days are Yesterday 12.2 mm, Today till now (10:08 AM) it's 2.6mm.
December month average is 138 mm, hoping the RAIN god to attain this atleast for the good of Chennai.
Today's wind direction is good for the rain...take a look it's mostly North-North-East.
There's nothing visible on the latest satellite pic, you can view it here
November 2007 was a disaster regarding North-East monsoon, Chennai city received only 95 MM of rain against a normal of 308 MM.
Category:
North East Monsoon
Subscribe to:
Posts (Atom)